Simulation
We have now solved the model in a couple of ways and we have plotted the policy rules. A useful way of learning abou the properties of the model solution is to simulate a time series of the economy. We can then plot the simulated data or compute moments like standard deviations and correlations. We will consider two types of simulations. First we will see how the economy evolves in response to some randomly generated productivity shocks. Second we will look at the impulse response functions (IRFs) of the model: the response to a single productivity shock.
We will use a single Simulate function to perform both tasks. This function takes the parameter structure and the policy rule for savings as arguments. In addition, the function has an argument Mode that acts as a switch for generating random productivity shocks and for computing impulse response functions. The final argument Simulate is simply the number of time periods of the simulation.
function Sim = Simulate(Par,bKp,Mode,T)
% Sim = Simulate(Par,bKp,Mode)
%
% Simulates the model.
%
% Inputs:
% Par       Parameter structure
% bKp       Polynomial coefficients for polynomial for Kp policy rule
% Mode      Mode = 'random' -> draw shocks
%           Mode = 'irf'    -> impulse response function


Sim.K = zeros(T,1);
Sim.Z = zeros(T,1);

Sim.K(1) = Par.Kstar;


if strcmp(Mode,'irf')
    Sim.Z(1) = Par.sigma;
    Eps = zeros(T,1);
elseif strcmp(Mode,'random')
    Sim.Z(1) = 0;
    Eps = Par.sigma * randn(T,1);
else
    error('Unrecognized Mode in Simulate.m');
end


for t = 2:T
    Sim.K(t) = PolyBasis(Sim.K(t-1),Sim.Z(t-1)) * bKp;
    Sim.Z(t) = Par.rho * Sim.Z(t-1) + Eps(t);
end


% Compute quantities from state variables
Ti = 2:T-1;
Kp = Sim.K(Ti+1);
Sim.K = Sim.K(Ti);
Sim.Z = Sim.Z(Ti);
Sim.Y = f(Par,Sim.K,Sim.Z) - (1-Par.delta) * Sim.K;
Sim.C = f(Par,Sim.K,Sim.Z) - Kp;

end
The function will return a structure with the fields K, Z, Y, and C corresponding to capital, productivity, output (GDP) and consumption. We begin by initializing empty arrays for our state variables K and Z. We then intialize the first capital stock to the steady state capital stock. The way we initialize the first productivity level depends on the mode we are operating in. For random productivities we just set Z(1) = 0. In this mode we also draw T normally distributed random values for our productivity shocks. If we are computing IRFs we will set Z(1) to a one standard deviation positive productivity shock. In this case, all future productivity shocks are set to zero because this is the definition of an IRF.
The main part of the simulation algorithm is the loop from 2 to T where we update the state variables based on the policy rule for savings and the stochastic process for productivity. Finally, we use the production function and aggregate reource constraint to compute Y and C from our state variables.
After running VFIHoward we could proceed as follows
%% Simulate

T = 1000;
Sim = Simulate(Par,bKp,'random',T);

% Compute moments from simulated data
disp(['St. dev. of log Y = ' num2str(std(log(Sim.Y))) ]);
disp(['St. dev. of log C = ' num2str(std(log(Sim.C))) ]);
CY_corr = corrcoef(Sim.C,Sim.Y);
disp(['Corr. of C and Y = ' num2str(CY_corr(1,2)) ]);
This should print
St. dev. of log Y = 0.028755
St. dev. of log C = 0.020443
Corr. of C and Y = 0.93693
We could do the same thing after running EulerIteration but we before we do so we would need to compute the coefficients for the savings policy rule (as opposed to the consumption policy)
bKp = PolyGetCoef(Grid.KK,Grid.ZZ, f(Par,Grid.KK,Grid.ZZ) - PolyBasis(Grid.KK,Grid.ZZ)* b);
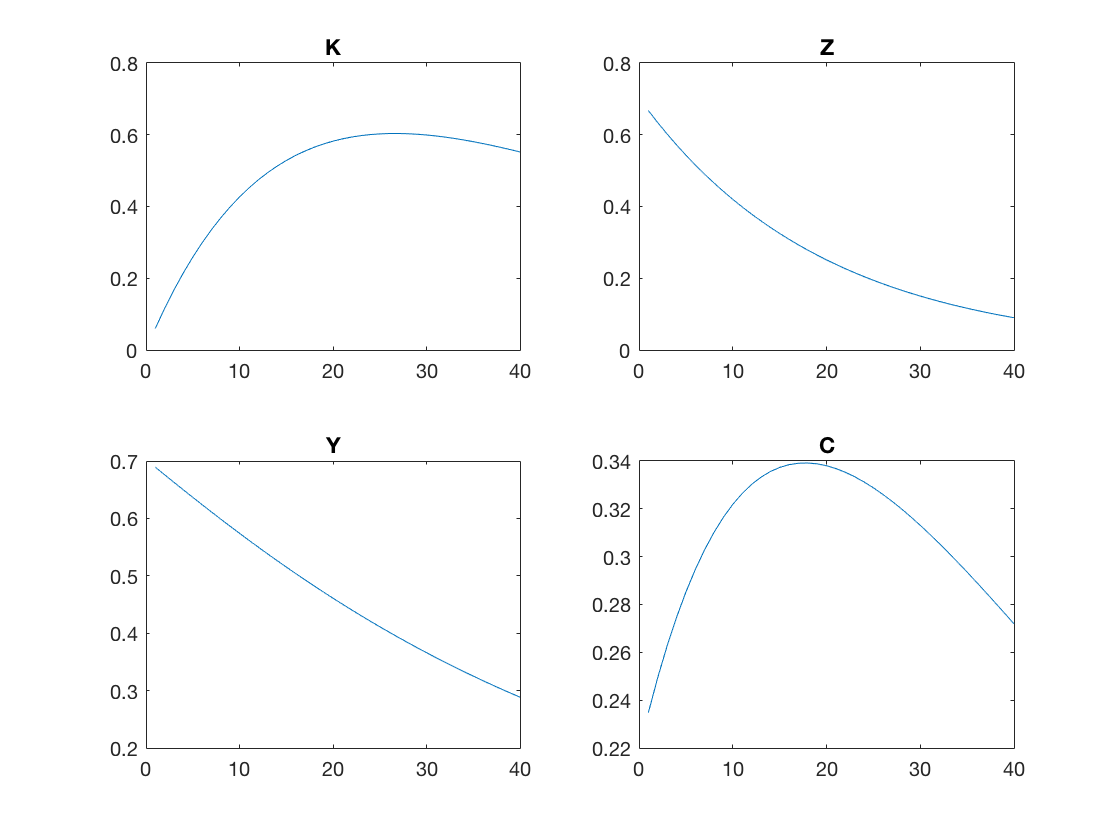
In order to compute and plot our IRFs we could do this
T = 42;
Sim = Simulate(Par,bKp,'irf',T);

% create a steady state structure with same fields as Sim
SS.K = Kstar;
SS.Z = 0;
SS.Y = f(Par,SS.K,SS.Z) - (1-Par.delta)*SS.K;
SS.C = SS.Y -Par.delta*SS.K;

% convert to the level of TFP from log TFP
Sim.Z = exp(Sim.Z);
SS.Z = exp(0);

figure;
T = length(Sim.Y);

subplot(2,2,1);
plot(1:T, 100*(Sim.K - SS.K)/SS.K );
title('K');

subplot(2,2,2);
plot(1:T, 100*(Sim.Z - SS.Z)/SS.Z );
title('Z');

subplot(2,2,3);
plot(1:T, 100*(Sim.Y - SS.Y)/SS.Y );
title('Y');

subplot(2,2,4);
plot(1:T, 100*(Sim.C - SS.C)/SS.C );
title('C');
You should see this.
As a final thought, it is a bit tedious to type all those plot commands but there is an easier way using dynamic referencing of structures.
figure;
T = length(Sim.Y);
flds = fieldnames(Sim);
for i = 1:numel(flds)
    subplot(2,2,i);
    plot(1:T, 100*(Sim.(flds{i})-SS.(flds{i}))/SS.(flds{i}) );
    title(flds{i});
end
Here we have created a loop over the fields of our Sim structure. The field names are stored in flds
flds =

  'K'
  'Z'
  'Y'
  'C'
The loop runs for i = 1 to i = 4 and Sim.(flds{1}) is equivalent to Sim.K and so on. In this way we can do operations on all the fields of a structure in a loop.